


Jasveer Pillay, Aliya Singh, Kerina Virasamy, Pragesh Govender, Riaan Stopforth
ORCID ID: 0000-0002-0640-7480, 0000-0003-1754-447X, 0000-0001-9837-7794,
0000-0001-5173-4379, 0000-0002-8878-2232
Stopforth Mechatronics
Robotics and Research Lab
University of KwaZulu-Natal
Durban
South Africa
This research aimed to develop a liquid oxygen tank valve defrosting system that could be used in hospitals to enable a steady supply of oxygen even during cold weather or periods of high oxygen demand. The system was intended to be used as a viable alternative to the hosing systems currently used in many South African hospitals by being partially autonomous and environmentally friendly in its design and operation. Based off conducted research and interviews from hospital personnel, focus was placed on developing a defrosting system that used flowing water to melt ice. The development of the defrosting system was successful, and the system was able to conduct the independent tests reliably. Although the conducted testing did not involve using the defrosting system on a real liquid oxygen gas tank’s frozen valve, various analyses were conducted with respect to flow rate performance, effects of water loss and the degradation of performance due to cold temperatures. Based off practical testing on ice, it was concluded that the system should be able to perform similarly if used on the liquid oxygen tank valves of hospitals and that the defrosting system should theoretically prove effective even under high oxygen demand or cold weather. The developed defrosting system should be an effective solution to the stated predicament of frozen oxygen tank valves in hospitals and is theoretically a viable alternative to the hosing system currently used by many South African hospitals.
Keywords: liquid oxygen tank, gas tank, frozen valve, defrost valve, melt ice, spray water, shower, water pump, defrosting device, defrosting system
The following sections outline the background, aims and objectives, review of existing systems, and research contributions.
i. Background
The valves found in liquid oxygen tanks used in hospitals tend to develop a build-up of ice. In situations where there is a high demand for oxygen in a hospital or during cold weather, the ice accumulation hinders oxygen delivery to patients. The issue of frozen oxygen tank valves is more prevalent in recent times as there exists a higher-than-average demand for oxygen in South African hospitals during the COVID-19 pandemic (Anand, 2021; Poonipershad, 2021).
ii. Aims and Objectives
In response to the above-mentioned scenario, this research aimed to develop a liquid oxygen tank valve defrosting system that could be used in hospitals to deliver a steady oxygen supply even during cold weather or periods of high oxygen demand. The system was intended to be partially autonomous and environmentally friendly in its design and operation to be a viable alternative to the hosing system generally used in South African hospitals. The following points list the objectives of the defrosting system design:
iii. Review of Existing Systems
The defrosting system currently used by hospitals involves manually operating a hosepipe to spray water on the valves, which is done daily for approximately one hour (Anand, 2021). Based off interviews conducted, the hosepipe system could be improved by automating most of the process and using a more sustainable design that reduces water wastage (Anand, 2021; Poonipershad, 2021). KJM Industries have implemented a system of showers to defrost ice from oxygen tank vaporisers during the COVID-19 pandemic (Matheson & KJM, 2021). Their reasoning for implementing their system was that it allowed defrosting without the need for heaters, which are considered hazardous near oxygen tanks (Matheson & KJM, 2021). KJM Industries' system was designed to defrost the vaporisers of oxygen tanks, and it is unproven to be a viable solution for defrosting oxygen tank valves.
Based on the research conducted, it was understood that valves found in liquid oxygen tank systems are known to freeze in addition to the vaporiser unit and its piping (Matheson & KJM, 2021). The oxygen tank components known to freeze were confirmed through investigative research and consultations with hospital personnel (Anand, 2021). It was determined that the vaporiser was most prone to freezing and the vaporiser-tank valve was least prone to freezing. However, a frozen vaporiser-tank valve would hinder oxygen delivery more so than when the other components freeze (Anand, 2021). Hence, the focus was placed on designingthe defrosting system to defrost oxygen tank valves and not the vaporiser or other components.
Freeze protection valves are used in systems to prevent or reduce ice buildup (Thermomegatech, 2011). Freeze protection valves are typically used in waterbasedsystems, such as water inlet or supply piping (Hughes, 2021). Freeze protection valves can be considered a commercially-off-the-shelf (COTS) component, hence provided that the freeze protection valve is of appropriate compatibility with the oxygen tank, it can be installed with relative ease (Thermomegatech, 2011). Freeze protection valves were not included in the design as it was unproven to be a suitable solution to the freezing of liquid oxygen tank valves as freeze protection valves are commonly used in water-based applications (Hughes, 2021).
In many industrial applications, valves are enclosed in blanket heaters or heated enclosures known as “hotboxes” (Pape & Watlow, 2008). These heating enclosures are typically made from silicone rubber and contain heating elements that generate heat within the enclosure around the valve (Pape and Watlow, 2008). Alternate systems used to heat valves with external heat sources include using heating element designs such as tubular, cable or cartridge heaters (Pape & Watlow, 2008). These heating element designs are generally placed in direct contact with the valve or in the open air near the valve (Pape & Watlow, 2008). Though the heating solutions mentioned above have proven efficient in many applications, external heat sources are not favourable solutions when designing for systems in close proximity to liquid oxygen (Dugdale, 2020). Liquid oxygen is highly combustible, and fire hazards are not allowed near systems using liquid oxygen (University of Florida, 2016). Though the external heat sources do not produce an open flame, it can be considered a safety hazard (University of Florida, 2016). For these reasons, external heat sources were not used in the defrosting system's design.
iv. Research contributions
The contributions of this research are the following:
The following sections outline the development of the defrosting system's design, and the testing methodology used for each of the practical tests that were conducted.
i. Development of the defrosting system's design
After taking the research and interviews conducted with hospital personnel into consideration, a defrosting system was designed to spray water onto the valve to defrost it. The method of spraying water on frozen components was an effective method in defrosting oxygen tank vaporiser units and could be applied to the valve system, which would have a similar frost build-up to the oxygen tank vaporiser (Matheson & KJM, 2021). This defrosting method was confirmed to be used by hospitals in South Africa as interviews were conducted with hospital workers (Anand, 2021; Poonipershad, 2021). Hence, this research's defrosting system should be effective in defrosting the valves of the oxygen tanks as it makes use of similar water spraying solutions.
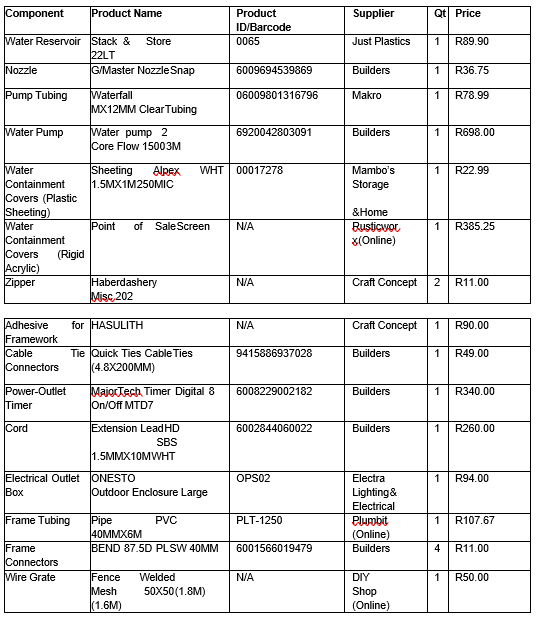
The system was intended to be made from predominantly COTS components to ensure it could be easily implemented, maintained and be sustainable in its construction. The design was composed entirely of COTS components and only requires components such as rigid-polyvinyl-chloride (RPVC) piping and pump tubing to be cut to appropriate lengths. Table 1 depicts the major COTS components used in the defrosting system's construction.
The system was designed for recycling most of the water used to spray the valve. The reservoir system implemented into the design was comprised of a reservoir base, water pump and water containment cover. Theoretically, most water would be recycled into the system effectively as the water containment covers would redirect most of the water into the reservoir. Additionally, components such as the wire grate, electrical outlet box and water containment covers were chosen and implemented with careful consideration to the risk management of the system in accordance with ISO 14971:2007, as each component ensured safety of the user and surrounding equipment during operation (ISO, 2007).
A key objective of the defrosting system was to design it to be incorporated into a variety of oxygen tank set-ups found in most South African hospitals. Through research and interviews with hospital workers, the dimensional constraints of the oxygen tank set-up were approximated, and a system could be designed to fit most scenarios. The dimensional constraints used were 1m x 0.3m x 0.2m and were obtained through interviews with hospital personnel and on-site measurements taken at King George Hospital (Anand, 2021). Additional design considerations were taken into account to accommodate oxygen tank set-ups that were not typical as the components that make up the defrosting system design can be cut to shorter lengths, or alternate components can easily be sourced and incorporated. Having components that could easily be dimensioned and swapped for more suitable alternatives was made possible because it was made entirely from COTS components. Hence, none of the parts would need to be specially manufactured to fit specific scenarios.
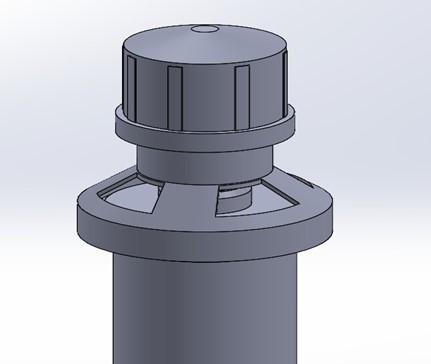
The design of the defrosting system can be seen in Figure 1. Figure 1 does not depict the electrical cabling and digital timer that would be present in the completed defrosting system design.
To determine the preliminary performance of the defrosting system, a prototype version of the system was developed for experimentation. Three general tests were devised, and the objectives of the experiments were to determine the actual flowrate of the water pump in the given configuration, the approximate rate of water loss during operation, and to determine if cold water temperatures would significantly reduce the effectiveness of the defrosting system. Measuring tape was used to measure the different head heights, a stopwatch was used to record the time and a thermometer was used to record the water temperature. Three different tests were conducted using different experimental procedures to achieve the desired set of data and are briefly elaborated on in the following sections. The general set-up for the experiments can be seen in Figure 2. Each of the three tests were conducted with consideration to the risk management of the system in accordance with ISO 14971:2007, as the different electrical cables and relevant connections were encased or kept away from water sources during operation (ISO, 2007).
ii. Testing methodology for flow rate test
The defrosting system prototype was filled with water and the water pump was switched on. The outlet was held at varying head heights and the time taken to fill a 250ml cup was recorded. This procedure was repeated at an alternate pump setting to gauge the performance range of the pump under the specified conditions.
iii. Testing methodology for water loss tests
The water loss tests involved conducting three separate tests. Two tests were to evaluate the water lost due to water splashes. Each test was conducted on the same prototype but with and without a front panel. This was done to evaluate if it was necessary to include a front panel in the design. The tests were conducted by measuring the difference in water level head height of the reservoir after allowing the system to operate for 24 hours. The final water loss test was done to evaluate on average how much water would be lost due to evaporation, hence the reservoir of the prototype was filled and left to stand for approximately four weeks. The new water level height was thereafter recorded with a tape measure.
iv. Testing methodology for temperature test
This test involved measuring the time taken for the prototype system to melt crushed ice in a perforated container. The time taken to melt through approximately 0.12m of ice as well as the time to melt all the ice in perforated container were recorded separately. These steps were repeated numerous times to allow the melted crushed ice to gradually lower the temperature of the reservoir water and therefore yield different data in each iteration. The entire procedure was conducted once more to ensure consistency of results.
The following sections outline the results obtained from each of the tests conducted on the prototype design followed by a brief analysis of the data.
i. Results and discussion for flow rate test
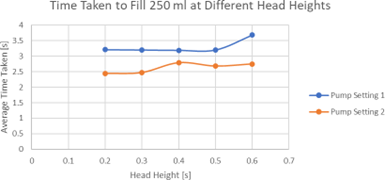
The experimental procedure for the flow rate test was performed and the results can be seen in Figure 3 and Figure 4. The average time to taken to fill the 250ml container was recorded at different pump settings and head heights and is represented graphically in Figure 3.
The corresponding flow rate for each reading was calculated based off the average time taken to fill the 250ml container and the results are represented graphically in Figure 4.
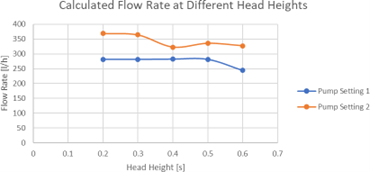
Analysis of the flow rate test showed that the defrosting system did not deliver a constant flow rate of 1000 l/h, but rather delivered a maximum flow rate of 281.25 l/h at pump setting 1 and a maximum flow rate of 368.85 l/h at pump setting 2. Both settings delivered their maximum respective flow rates at the lowest head height tested which was 0.2 m. This was in accordance with theoretical expectations as lower head heights would provide better pump performance. Despite the defrosting system not reaching the target flow rate, it still performed as expected in melting ice as can be seen in following tests. A possible reason for why a flow rate of 368.85 l/h is sufficient despite the not meeting the target specification is likely due to the target being set higher than needed for the required task. The target specification was obtained from the flow rate used at hospitals. Possible reasons for the underperformance of the pump, despite having a marketed operating flow rate of 1500 l/h, could be due to the pump being defective, inaccurate testing or equipment, or the pump being incorrectly configured.
ii. Results and discussion for water loss tests
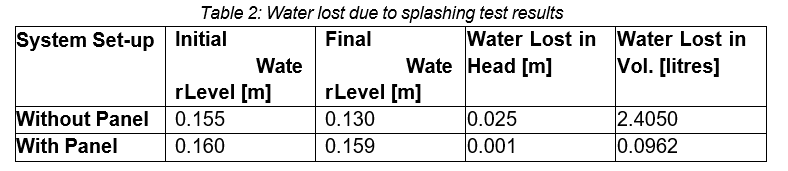
The experimental procedure to find the amount of water lost due to splashing was performed and the results can be seen in Table 2. The initial and final water levels for each system set-up was recorded and the amount of water lost was calculated.
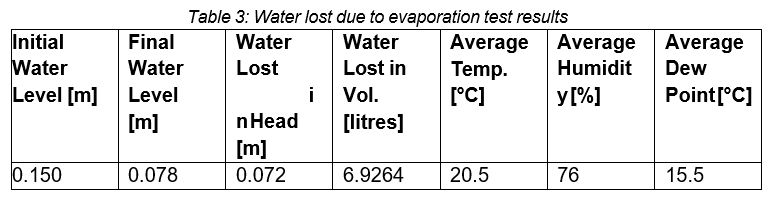
The experimental procedure to find the amount of water lost due to evaporation was performed and the results can be seen in Table 3. The initial and final water levels were recorded, and the amount of water lost was calculated. The test was conducted in Durban, South Africa, between 23 September 2021 and 21 October 2021. The average temperature, humidity and dew point during the testing period was approximated based off data from TimeAndDate (2021).
Analysis of the water loss tests yielded results that aided in predicting expected water loss under different conditions. It could be seen that prior to the addition of the front panel, the water lost due to splashes of water during operation would have been significant, as it lost 0.025m of height in terms of water level. Without additional water added, the reservoir would have lost approximately 0.065m head of water in 2.6 days, hence the pump would not be able to function with a water level of 0.085m. The addition of the front panel significantly reduced the amount of water lost due to splashing during operation. In contrast, it saved approximately 96 % of the water lost prior to the modification.
The water loss test regarding the water lost to evaporation showed one example of the amount of water that could be lost given the conditions specified in the test. This value is significant but is only applicable to specific scenarios as the result was highly dependent on environmental factors such as the temperature, humidity and dew point within a specific location and time range. Further testing in operation would need to be conducted to determine if the added water in the form of ice, as well as from naturally occurring rainwater would make up for the water loss.
iii. Results and discussion for temperature test
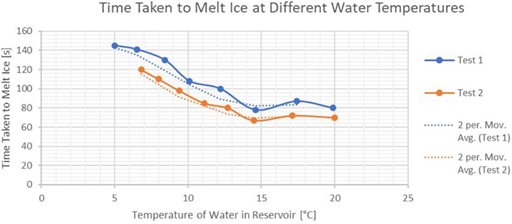
The experimental procedure for the temperature test was performed twice and the results can be seen in Figure 5 and Figure 6. The time to taken to melt the crushed ice at different water temperatures and the developed moving average trendline in both tests is shown in Figure 5.
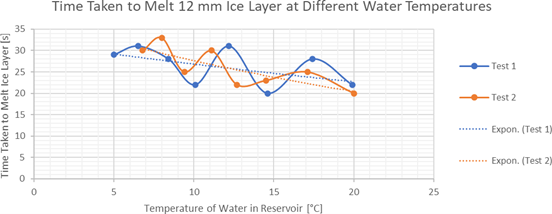
The time taken to melt the 12mm ice layer at different water temperatures and the developed exponential trendline in both tests is shown in Figure 6.
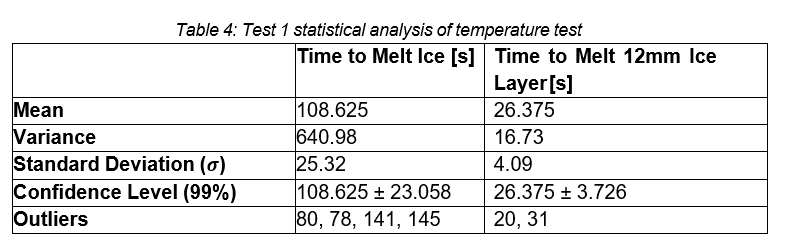
Statistical analysis was conducted on the temperature test data for Test 1 and Test 2 with respect to the recorded time readings. The results can be seen in Table 4 and Table 5.
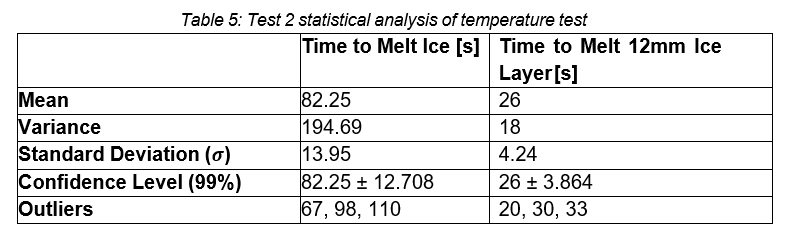
Statistical analysis of the time taken to melt ice, corresponding to Figure 5, Table 4, and Table 5, yielded the following results: the mean, variance and standard deviation were 108.625, 640.98 and 25.32 respectively for Test 1 and 82.25, 194.69 and 13.95 respectively for Test 2. Hence, there were significant differences in the calculated statistical values for Test 1 and Test 2 and such discrepancies could have been attributed to environmental factors that weren’t considered or human error. However, their respective trendlines as seen in the graphical representation of the tests display similar trendlines, and thus those were used for further analysis.
Statistical analysis of the time taken to melt the 12mm ice layer, corresponding to Figure 6, Table 4, and Table 5 yielded the following results: the mean, variance and standard deviation were 26.375, 16.73 and 4.09 respectively for Test 1 and 26, 18 and 4.24 respectively for Test 2. It was observed that both tests yielded relatively consistent statistical values, and thus the data was used for further analysis.
The tests conducted to analyse the effects of increasingly colder reservoir water temperatures on the overall effectiveness of the system’s ability to melt ice was useful. In the test conducted to see the time taken to melt the entire container of ice, a similar graph shape was observed between both separately conducted tests. This observation was confirmed by noting the identical shape of both tests' moving average trendlines. It could be observed that although the effectiveness of the system’s ability to melt the container of ice was reduced with colder reservoir temperatures, the differences were not of concern as it was never entirely or practically ineffective. The difference in time was approximately one minute to melt the ice in the container.
The temperature test also yielded results for the time it took to melt a 12mm layer of ice in the container, and it showed that, at the warmest reservoir temperature, it took an average of 20 seconds to melt, whereas at the coldest temperature, it took an average of 30 seconds. These results are acceptable as the rate of ice melting was decreased but did not make the defrosting system ineffective.
The defrosting system design successfully developed and fulfilled the aims and objectives of this research. The defrosting system was developed to use water sprays as the method of defrosting based off conducted investigations. The physical defrosting system was successfully constructed and used for independent testing. Practical tests were conducted using the defrosting system on ice which demonstrated that the system could reliably melt ice at varying water temperatures, despite using an under-powered pump. Analysis of the water loss tests showed that the defrosting system's water containment covers retained roughly 96% of water that would have been lost due to splashes, thereby ensuring much of the water could be recycled. The developed defrosting system should be an effective solution to the predicament of frozen oxygen tank valves in hospitals and should theoretically be a viable alternative to the hosing system employed by South African hospitals currently.
The contributions of this research were achieved in the following ways:
The authors are thankful for the support and sponsorship of MerSETA, MediVentors, Dr D Chivers and Dr R Swart and all interviewed participants who provided their professional insight and expertise on the matter. We would also like to thank the personnel at King George Hospital for their input and for granting us permission to visit their facilities.
Anand, M. (2021, April 26). Artisan Foreman at King George Hospital. (J. Pillay, Interviewer)
Dugdale, D. (2020, December 1). Oxygen safety: MedlinePlus Medical Encyclopedia. Medline Plus. https://medlineplus.gov/ency/patientinstructions/000049.html
Hughes. (2021). Freeze Protection Valve. Retrieved April 2, 2021, from https://www.hughes- s afety.com/freeze-protection-valve.html
ISO, 2007. ISO 14971: 2007 Medical devices- Application of riskmanagement to medical devices. [Online]. Available at: https://www.iso.org/standard/38193.html. [Accessed 20 October 2021]
Matheson & KJM. (2021, March 30). COVID Readiness - Bulk Hospital Vaporiser Guidance. Retrieved from https://hcai.ca.gov/wpcontent/uploads/2020/12/02-Pressure-Drop-12-22-20.pdf
Pape, J., & Watlow. (2008, April 1). Using Heat to Protect Valves | 2008-04-01 | Process Heating. Using Heat to Protect Valves. https://www.processheating.com/articles/86464-using-heat-to-protect-valves
Poonipershad, D. (2021, April 28). Specialist Anaesthetist at St Augustine's Hospital. (J. Pillay, Interviewer)
Thermomegatech. (2011, November 30). Freeze Protection Valves Keep Your Water Lines from Freezing. https://www.thermomegatech.com/freezeprotection-valves/
TimeAndDate. (2021, October 26). Climate & Weather Averages in Durban,South Africa. https:// https://www.timeanddate.com/weather/south-africa/durban/climate
University of Florida. (2016, December 2). Liquid Oxygen » Environmental Health & Safety » University of Florida. Information Specific to Liquid Oxygen.https://www.ehs.ufl.edu/programs/lab/cryogens/oxygen/